

10 Years After the Taper Tantrum, The Bond Market is Having Another Moment
Your financial plan can weather times like these, make sure your emotions don’t get the best of you.
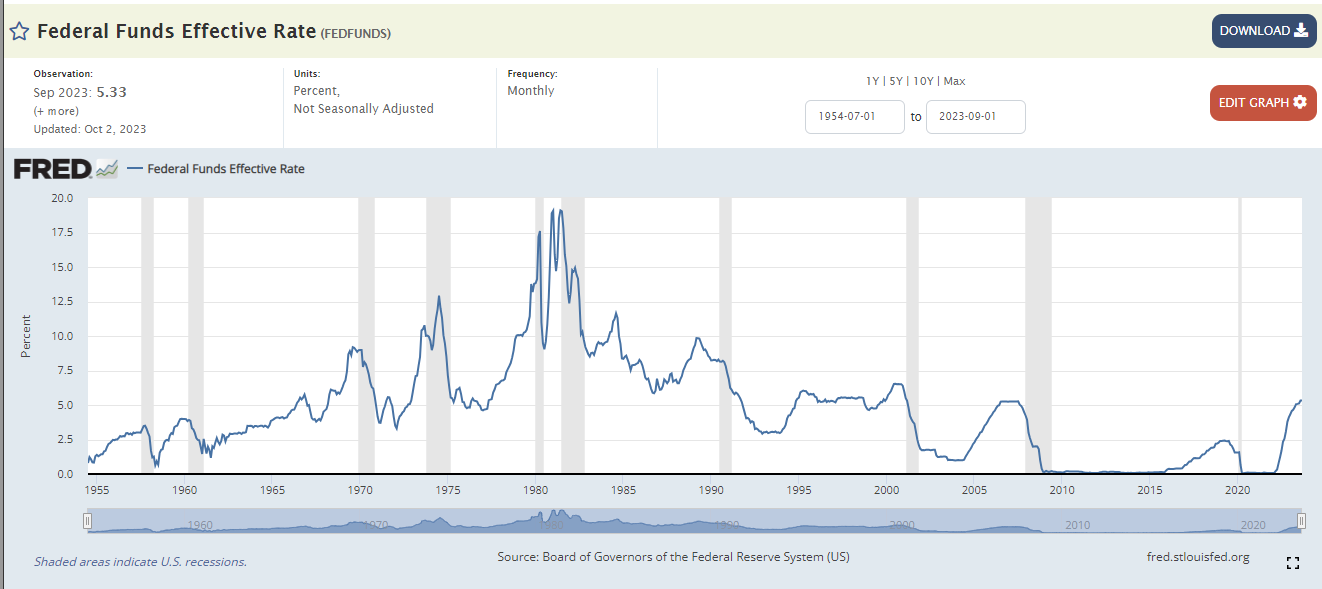
What started off as a promising year for both stocks and bonds as by the mid-year investors were looking at solid double digit returns for the former and mid-single digit returns for the latter only to see those gains shrink or evaporate altogether over the last 2+ months. There are plenty of theories to explain the sagging performance, but it’s safe to assume that much of this has to do with interest rates both present and expected and how those rates influence asset prices. When we think about interest rates, the tendency for many investors is to focus on Central Bank policy, after all the 8 meetings per year have become something of a spectacle with traders hanging on every word found in the rate decision transcript and as evidenced by the pronounced volatility during the Chairman press conference where he fields questions from the audience of journalists and economists alike. “Fed Funds” as it is generally referred to is overnight rate set by a rotating group of nine voting members which make up the Federal Open Market Committee. This rate is effectively the rate that banks charge one another to borrow excess reserves necessary to meet capital requirements. In simple terms they are, in essence, a floor rate for the economy. Dating back to the days of Alan Greenspan, who introduced the concept of forward guidance, the Federal Reserve has gone to great lengths to ensure that they telegraph their monetary policy intentions so as not to surprise various market participants and provide a bit of predictability to the credit markets and economy as a whole. Below is a chart from the St. Louis Fed showing Fed funds for the last 70 years or so.
But hasn’t the Fed only raised rates a measly .25% since June, so why so much commotion? As it turns out short-term rates, while awfully important, represent only a modest slice of the fixed income market and better proxy for the bond markets is the 10-year Treasury. Since most investor’s portfolios are comprised of fixed income securities maturing more than a year from now, the 10 year is a better gauge than the Fed Funds rate which today is around 5.33%. Price and yield here are influenced by factors such as basic supply and demand to growth and inflation expectations along with currency strength or weakness and rate differentials to name just a few. If we take a closer look at this rate, you can see it’s been a noisy 2023. At the close of 2022, the 10 Year yield was 3.83%, almost immediately it started drifting lower as concerns about a slowing US economy and the probability of a recession seemed high. The first week of April it touched the 3.29 marking the year low and after a brief retest about a month later started an orderly ascent back to the same 3.8% level by the end of Q’2. If you had been asleep for 6 months you would have assumed it was a quiescent first half of the year, saying nothing of a mini banking crisis. Something changed in the first couple weeks of July when rates jumped nearly 20 basis points (1 basis point equals 1/100th of 1.00%), a large move absent any real economic data that could be considered a catalyst. Thinking that was perhaps a bit of a head fake, rates were back around 3.85-3.90% by the end of July before taking off. August saw rates move higher at one point touching 4.31% only to wrap up the month at 4.09% before, a good size move in a month but nothing out of the ordinary. September was basically a one way ticket as rates seemingly moved higher day after day ending the month at 4.57% a nearly ½ percent move and we have jumped another 20 basis points in the first week of October.
So, what are the root causes and why does this matter aside from the drubbing longer term bonds have taken? To put things into perspective, according to Bloomberg the “long bond” which is the nickname for the 30 year maturity, has dropped nearly 50% in value since 2020, so much for the safety of the full faith and credit of Uncle Sam as that is on par with the decline witnessed in stocks during the Great Financial Crisis. The following are likely culprits behind the rise in yields.
- Significant budget deficits are being funded with new issuance, the added supply as the result of $1TT deficits is not as easily absorbed by the markets
- Foreign holders have likely been liquidating holdings to stabilize their currency (Japan) or their economy (China)
- As evidenced by the Fed’s Statement of Economic Projections (SEP) they see rates higher for longer and the prospects for cutting rates have diminished or been pushed back.
- The probability of a recession has declined making duration less necessary or appealing.
- Dysfunctional government calls into question fiscal responsibility warranting higher borrowing costs.
- Fed Reserve continues to shrink its balance sheet by not reinvesting the principal and interest payments with their massive portfolio amassed over the last 15 years through their aggressive QE programs.
This list is hardly all encompassing, but as investors have been punished for holding bonds, there is a real possibility they could end 2023 in the red marking 3 successive years of declines, their appetite for debt instruments is waning. This feeds into pressure on stocks as the combination of relatively attractive, more predictable, if not safer returns, means justifying current valuations could be a stretch. Couple this with the fact that higher borrowing costs impact margins and profitability and could mean the next recession is more painful as those highly leveraged companies or cyclical companies are forced to make more draconian cuts to their labor forces when demand falls. An interesting recent analog would be the Taper Tantrum back in 2013 when the Fed Chair Ben Bernanke suggested it was possibly time to reduce the bond buying program used in the midst of the aforementioned Financial Crisis. Stocks sold off quickly in response to that announcement with the S&P dropping 10% in the span of 3 weeks and the 10 year jumped swiftly from 2% to 3%. At the risk of being overly technical, the 10 year bonds duration then was over 9 years meaning the 1% move took prices down nearly 10%. Today with higher rates, the duration of bonds is shorter so the increase from 3.80% to 4.80% actually resulted in smaller price decline. In the end, back in 2013 the Fed blinked and continued their bond buying program, inflation was still very low, unemployment nearly 8% and the scars from 2007-2009 still rather fresh allowing them to remain ultra-accommodative, hardly the case today. Perhaps the more helpful way of looking back at that period is to focus on investor reaction which was swift and tied to fear/emotion versus fundamentals, it may be that we are seeing the same thing today. When markets move quickly things may break or the worry that they may break can do wild things to asset prices. One thing seems certain, that with real yields (nominal rates less the rate of perceived future inflation) north of 2%, investors today are being rewarded for owning fixed income more than at any other time in the last 20 years. Only time will tell if this represents a generational buying opportunity or will rates move materially higher offering a better entry point. Acknowledging it’s been a disappointing if not somewhat painful period for those over indexed to bonds, especially of the longer variety, the bond market has its own version of corrections and now appears to be one of those times. It's clear the 40-year bull market that started in 1982 took its victory lap in 2020, the ensuing bear market will eventually end, just like we saw those green shoots in March 2009.
We’ll close on one very important fact that is important to keep in mind, bonds by and large offer far more certainty than stocks with their stated interest rates and defined maturities. A critical component of any diversified portfolio, it is best not to abandon them after having experienced declines in the last few years. For those looking to be a bit more opportunistic, earlier this year we had highlighted agency bonds, which are mortgage pass throughs, now offer rates north of 6.2% when going out 3+ years, which seems like an ample risk/return tradeoff. Many quality corporate issues and even some fixed to floating preferred stock offerings offer similarly attractive relative value. The result is likely as much as 1% of added return each year, when modeling out future portfolio returns for the next 10 years with common asset allocations like 60:40 or 70:30 (stocks to bonds.)